Matplotlib online: make Python charts in your browser
This free online matplotlib compiler runs real Python and real matplotlib in your browser. Write your plotting code in the editor above, press Run, and your chart appears under Plots, right beside your code. numpy and pandas are ready too: no pip install, no setup, no account.
Use it to finish a data science homework on a school computer, try a chart before putting it in a report, or follow a matplotlib tutorial without installing Python.
How to plot a graph in Python online
- Import pyplot:
import matplotlib.pyplot as plt - Draw something, such as
plt.plot([1, 2, 3], [4, 1, 6]), and add a title and axis labels. - Call
plt.show()and press Run. The chart opens under Plots; press PNG to download it.
Matplotlib examples to run
Each example opens in the editor above, ready to run and change. The picture under each one is the chart it makes.
Line plot
The most common chart: plt.plot() joins points with a line. Add a title, axis labels, a legend and a grid.
import matplotlib.pyplot as plt

years = [2019, 2020, 2021, 2022, 2023, 2024]
python = [42, 48, 55, 61, 66, 71]
javascript = [68, 67, 65, 64, 63, 62]

plt.plot(years, python, marker="o", label="Python")
plt.plot(years, javascript, marker="s", label="JavaScript")
plt.title("Language popularity (made-up data)")
plt.xlabel("Year")
plt.ylabel("Score")
plt.legend()
plt.grid(alpha=0.3)
plt.show()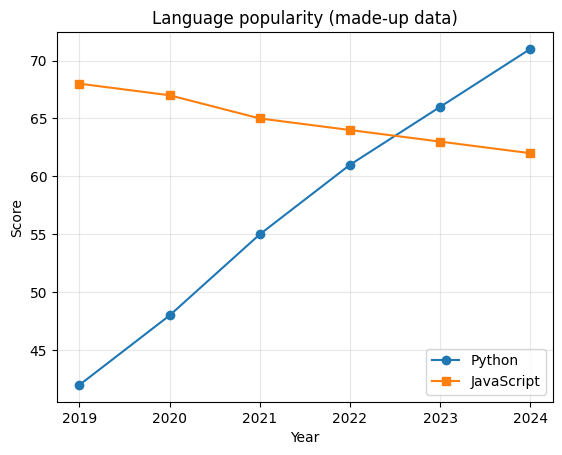
Bar chart
Compare amounts between categories with plt.bar(), and write each value on top of its bar.
import matplotlib.pyplot as plt

fruits = ["Apples", "Bananas", "Cherries", "Dates", "Grapes"]
sold = [45, 32, 18, 9, 27]

bars = plt.bar(fruits, sold, color=["tab:red", "gold", "crimson", "peru", "purple"])
plt.bar_label(bars)
plt.title("Fruit sold this week")
plt.ylabel("Boxes")
plt.show()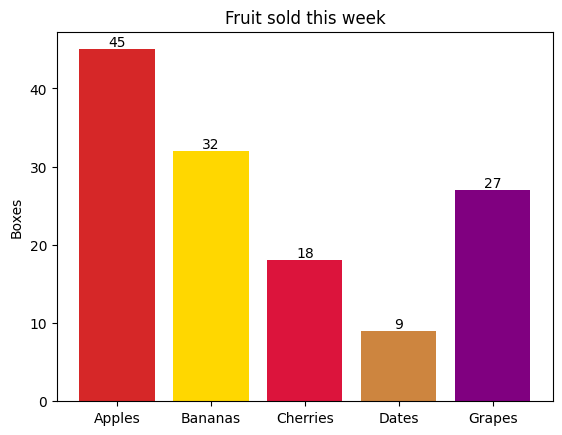
Scatter plot
Show how two values relate. Colour and size each point by a third and fourth value, with a colour bar.
import matplotlib.pyplot as plt
import numpy as np

rng = np.random.default_rng(42)
hours = rng.uniform(0, 10, 80)
score = 40 + 5 * hours + rng.normal(0, 6, 80)

plt.scatter(hours, score, c=score, s=hours * 15 + 20, cmap="viridis", alpha=0.8)
plt.colorbar(label="Score")
plt.title("Hours studied vs. test score")
plt.xlabel("Hours studied")
plt.ylabel("Score")
plt.show()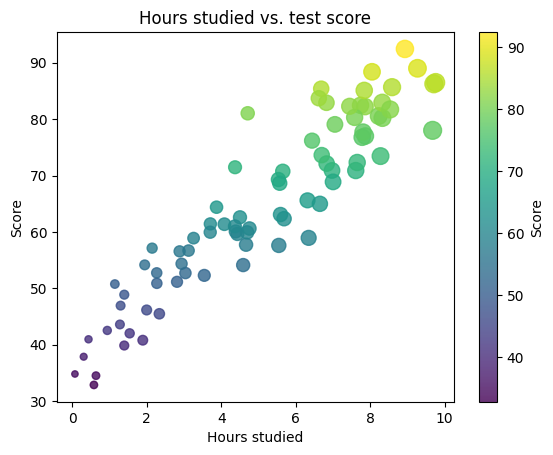
Histogram
See how values are spread out: plt.hist() counts how many fall into each range (bin).
import matplotlib.pyplot as plt
import numpy as np

rng = np.random.default_rng(7)
heights = rng.normal(170, 8, 1000)

plt.hist(heights, bins=30, color="tab:blue", edgecolor="white")
plt.axvline(heights.mean(), color="red", linestyle="--", label=f"Mean {heights.mean():.1f} cm")
plt.title("Heights of 1,000 people")
plt.xlabel("Height (cm)")
plt.ylabel("People")
plt.legend()
plt.show()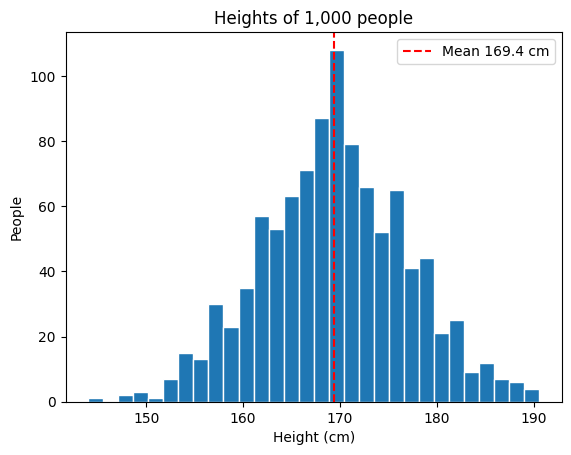
Pie chart
Parts of a whole with plt.pie(): percentages are added for you, and one slice is pulled out.
import matplotlib.pyplot as plt

activities = ["Sleep", "School", "Homework", "Games", "Other"]
hours = [8, 7, 2, 3, 4]

plt.pie(hours, labels=activities, autopct="%1.0f%%", startangle=90, explode=[0, 0, 0, 0.1, 0])
plt.title("A school day")
plt.axis("equal")
plt.show()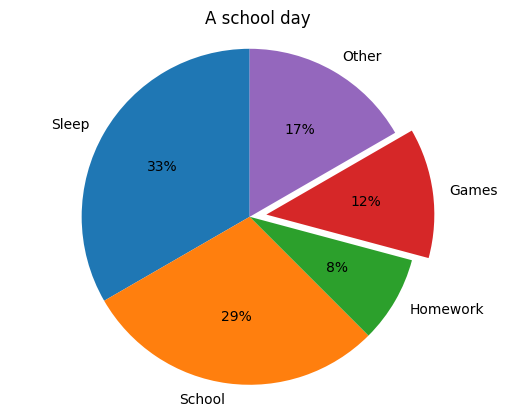
Several charts in one figure
plt.subplots() makes a grid of charts that share one figure, each drawn on its own axes.
import matplotlib.pyplot as plt
import numpy as np

x = np.linspace(0, 10, 100)
fig, axes = plt.subplots(2, 2, figsize=(9, 6))

axes[0, 0].plot(x, np.sin(x))
axes[0, 0].set_title("sin(x)")
axes[0, 1].plot(x, np.exp(-x / 3), color="tab:green")
axes[0, 1].set_title("exp(-x/3)")
axes[1, 0].bar(range(5), [3, 5, 2, 6, 4], color="tab:orange")
axes[1, 0].set_title("Bars")
axes[1, 1].scatter(x, np.cos(x) + np.random.default_rng(1).normal(0, 0.2, 100), s=10)
axes[1, 1].set_title("Noisy cos(x)")

fig.suptitle("Four charts, one figure")
fig.tight_layout()
plt.show()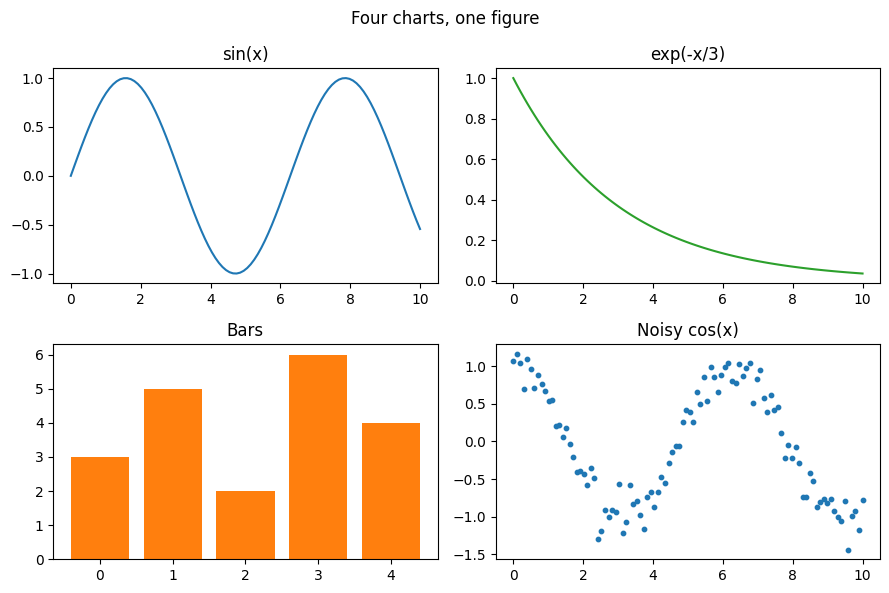
Plot a pandas DataFrame
pandas draws with matplotlib: df.plot() makes a chart straight from a table.
import pandas as pd
import matplotlib.pyplot as plt

sales = pd.DataFrame(
    {
        "Online": [120, 135, 150, 170, 160, 190],
        "In store": [200, 190, 185, 175, 180, 170],
    },
    index=["Jan", "Feb", "Mar", "Apr", "May", "Jun"],
)

sales.plot(kind="bar", figsize=(8, 4.5), title="Sales by month")
plt.ylabel("Orders")
plt.xticks(rotation=0)
plt.show()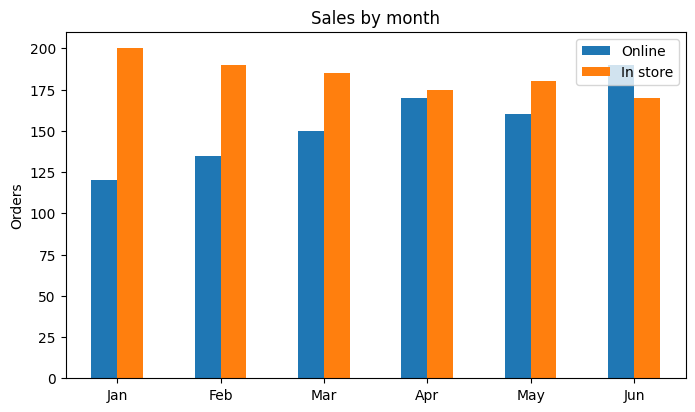
Heatmap
plt.imshow() colours a grid of numbers; here, a multiplication table with its values written in.
import matplotlib.pyplot as plt
import numpy as np

n = np.arange(1, 9)
table = np.outer(n, n)

plt.imshow(table, cmap="YlOrRd")
plt.colorbar(label="Product")
plt.xticks(range(8), n)
plt.yticks(range(8), n)
for row in range(8):
    for col in range(8):
        plt.text(col, row, table[row, col], ha="center", va="center", fontsize=8)
plt.title("Multiplication table")
plt.show()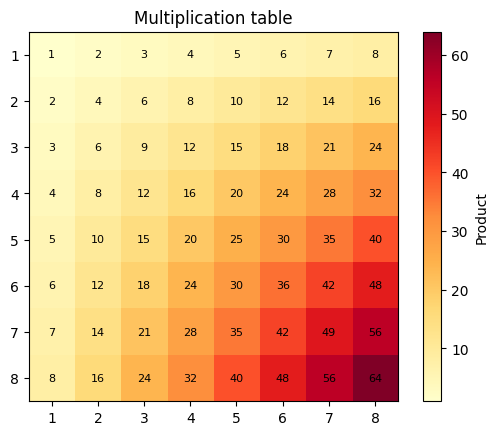
What works, and what doesn’t
- Every still chart: line, bar, scatter, pie, histogram, box plot, heatmap, subplots, 3D axes, annotations and colour maps.
- Several charts in one program: each
plt.show()adds one under Plots, in order. - pandas charts (
df.plot()) and seaborn (downloaded the first time you import it). - No windows, zooming or animation: charts are pictures, and an animation shows its last frame.
- Your computer’s files cannot be read; add data files in the file list on the left instead.
Frequently asked questions
Can I run matplotlib online without installing anything?
Yes. matplotlib, numpy and pandas are ready on this page: type your code, press Run and the chart appears under Plots. There is nothing to install and no account.
Why doesn't plt.show() open a window?
Your code runs inside the browser, where a program cannot open windows. Instead, every plt.show() puts the chart under Plots, next to the text output. Charts you make but never show appear there too when the program ends.
How do I save my chart as an image?
Press PNG under any chart to download it. plt.savefig("chart.png") also works inside your program, for example before reading the file back.
Does it work with pandas and seaborn?
pandas is ready, and df.plot() and df.hist() charts appear like any other. seaborn is downloaded the first time a program imports it, which takes a few extra seconds.
Can I make interactive or animated charts?
Not here: charts are pictures, so zooming, panning and widgets do not work, and an animation shows its last frame. Everything that makes a still chart works, including subplots, colour maps, annotations and 3D axes.
Which version of matplotlib is it?
matplotlib 3.5 on Python 3.12, through Pyodide (Python compiled for the web). The code is the same as on a computer; charts use matplotlib's own DejaVu Sans font.
matplotlib also works in the Python playground. New to Python? Start with the free beginner course, or make a game in the Pygame Playground.